
_______________________________
Distribution of Data

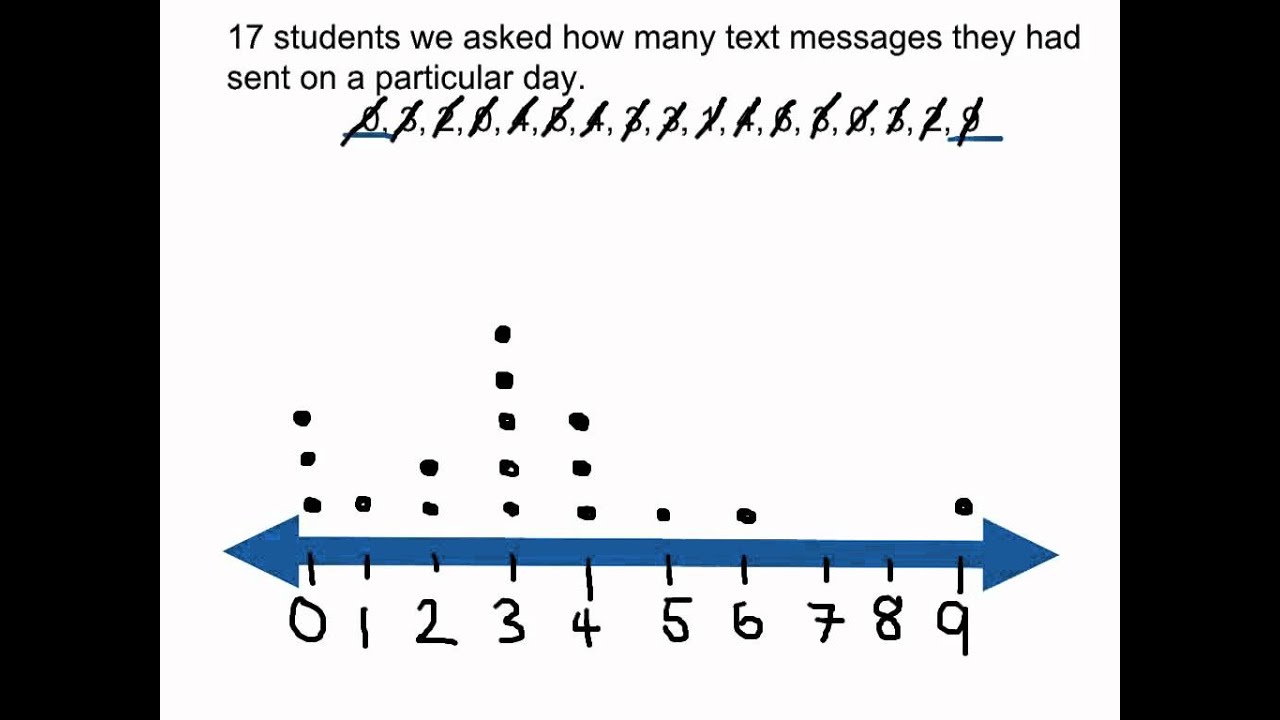
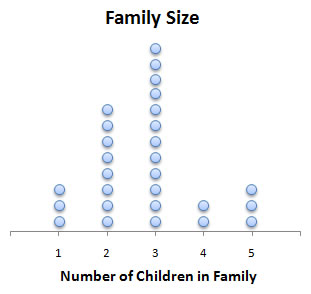
Cluster- where several data points are together
Gap- an interval with no data
Peak- data value that occurs most often
Outlier- One data point by itself, away from the cluster
**** You can have zero, one, or more clusters, peaks, or gaps
No comments:
Post a Comment