Miss Allen's 6th Grade Math
Background
Thursday, April 16, 2015
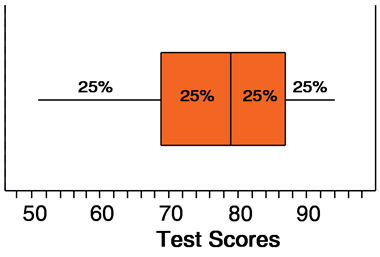
Box-and-Whisker Plot
Outliers can be marked with an * instead of being used as the minimum or maximum number.
_________________________________________
Friday, April 10, 2015
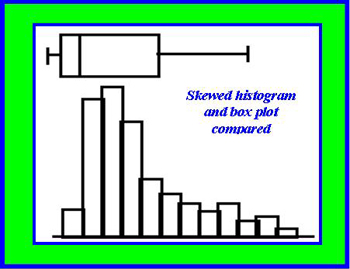
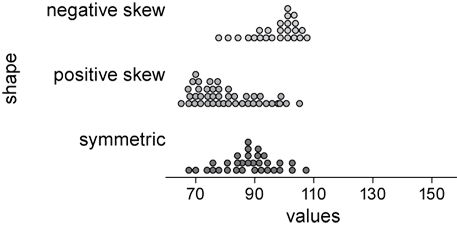
Shape of Distributions
You can use dot plots and histograms to identify shapes of
distributions
By recognizing the shape of distribution, you can better choose an appropriate measure of the data.
Thursday, April 9, 2015
Histograms
______________________
___________________________
Wednesday, April 8, 2015
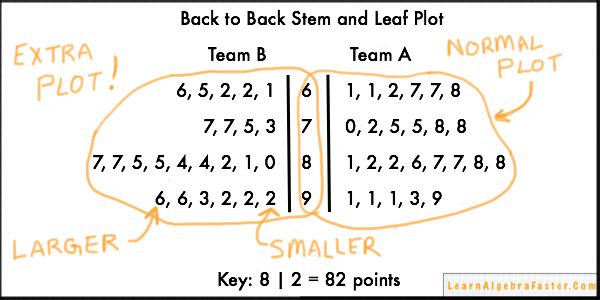
Steam-and-Leaf Plot
5, 8, 12, 30, 32, 48, 49
A stem-and-leaf plot uses the digits of data values to organize a data set. Each data value is broken into a stem and a leaf.
A stem and leaf plot shows how data are distributed.
Newer Posts
Older Posts
Home
Subscribe to:
Posts (Atom)