Background

Thursday, March 26, 2015

Mean Absolute Deviation - M.A.D.


Finding the Mean Absolute Deviation (MAD)
Step 1: Find the mean of the data.
Step 2: Find the distance between each data value and the mean.
Step 3: Find the sum of the distances in Step 2.
Step 4: Divide the sum in Step 3 by the total number of data values.


Tuesday, March 24, 2015

Quartiles and Interquartile Range

  1. Order the Data from least to greatest
  2. Find the median
  3. Split the data in half, lower half and upper half
  4. First Quartile- Find the median of the lower half
  5. Third Quartile - Find the median of the upper half
  6. The interquartile range- Take the third quartile and subtract the first quartile


**Quartiles show the spread of data

Range


Class Song for Range:
Home Home on the Range,
Take the High and subtract the Low
The data is spread 
a variation you see
Now, you are all as smart as me

Team one range: 78-72 = 6
Team two range: 84-67= 17
Team one has a difference of 6 inches between their players.
Team two has a difference of 17 inches between their players. 

Monday, March 23, 2015

Median and Mode


_________________________________

Mode is 6
_______________
There can be many modes or No modes!!!!!!
 - - - - - - - - - - - - - - - - - - - - - - - - - - - 

_________
________

_________

If there are 2 numbers in the middle 
Add the two numbers together
and divide by 2

_________

___________

Wednesday, March 18, 2015

Mean


64 + 77 + 79 + 80 + 84 + 86 + 90 + 90 + 94 + 96 + 97 + 98 =1035
1035 divided by 12 = 86.25

Compare two means
Team 1: 72 + 73 + 76 + 76 + 78 = 375
375 divided by 5 = 75 inches
Team 2: 67 + 72 + 76 + 76 + 84 = 375
375 divided by 5 = 75 inches
The two teams have the same mean!

Outlier affects the mean
Mean with the outliers: 35
Mean without the outliers: 25
With the outlier, the mean is a lot higher than without the outlier.  
The mean is best represented without the outlier. 


Friday, March 6, 2015

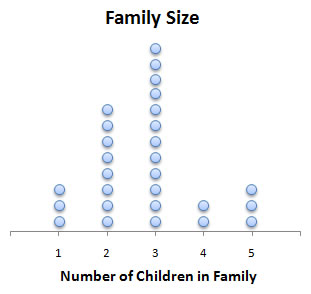
Dot Plots/ Line Plots


_______________________________

Distribution of Data
Cluster- where several data points are together
Gap- an interval with no data
Peak- data value that occurs most often
Outlier- One data point by itself, away from the cluster
**** You can have zero, one, or more clusters, peaks, or gaps

Statistical Questions


Statistical Questions are like those found on a survey. 
They provide a variety of answers. 

Examples: 
What is your shoe size?
What is your favorite food? 
How much does your dog weigh?

Not Statistical Questions:
What year did Tonaquint open? 
How many United States Presidents have there been?